
Recording: whole recordings
Recording shows one whole recording at a time. Use it to box the calls the model missed, tighten or answer the events it found, and mark the recording. Events is faster for answering events one by one. Recording is better when you need context.
Open it
Section titled “Open it”- From the start screen, choose the Recording card, then Start with recordings. Or press D and then Enter.
- From Events, press D or choose Recording in the top bar. The recording opens at the event you were on.
- A dataset with no events opens straight in Recording.
The Recording card on the start screen has its own options:
- Start at: Next recording without boxes, First recording, or Where I left off.
- Recordings: In order, Of interest first, or Only Of interest.
- Skip Nothing here: leave out recordings everyone marked Nothing here. Recordings with mixed marks stay.
- Labels: the labels this dataset uses. To change them, go to the dataset’s Labels tab.
The screen
Section titled “The screen”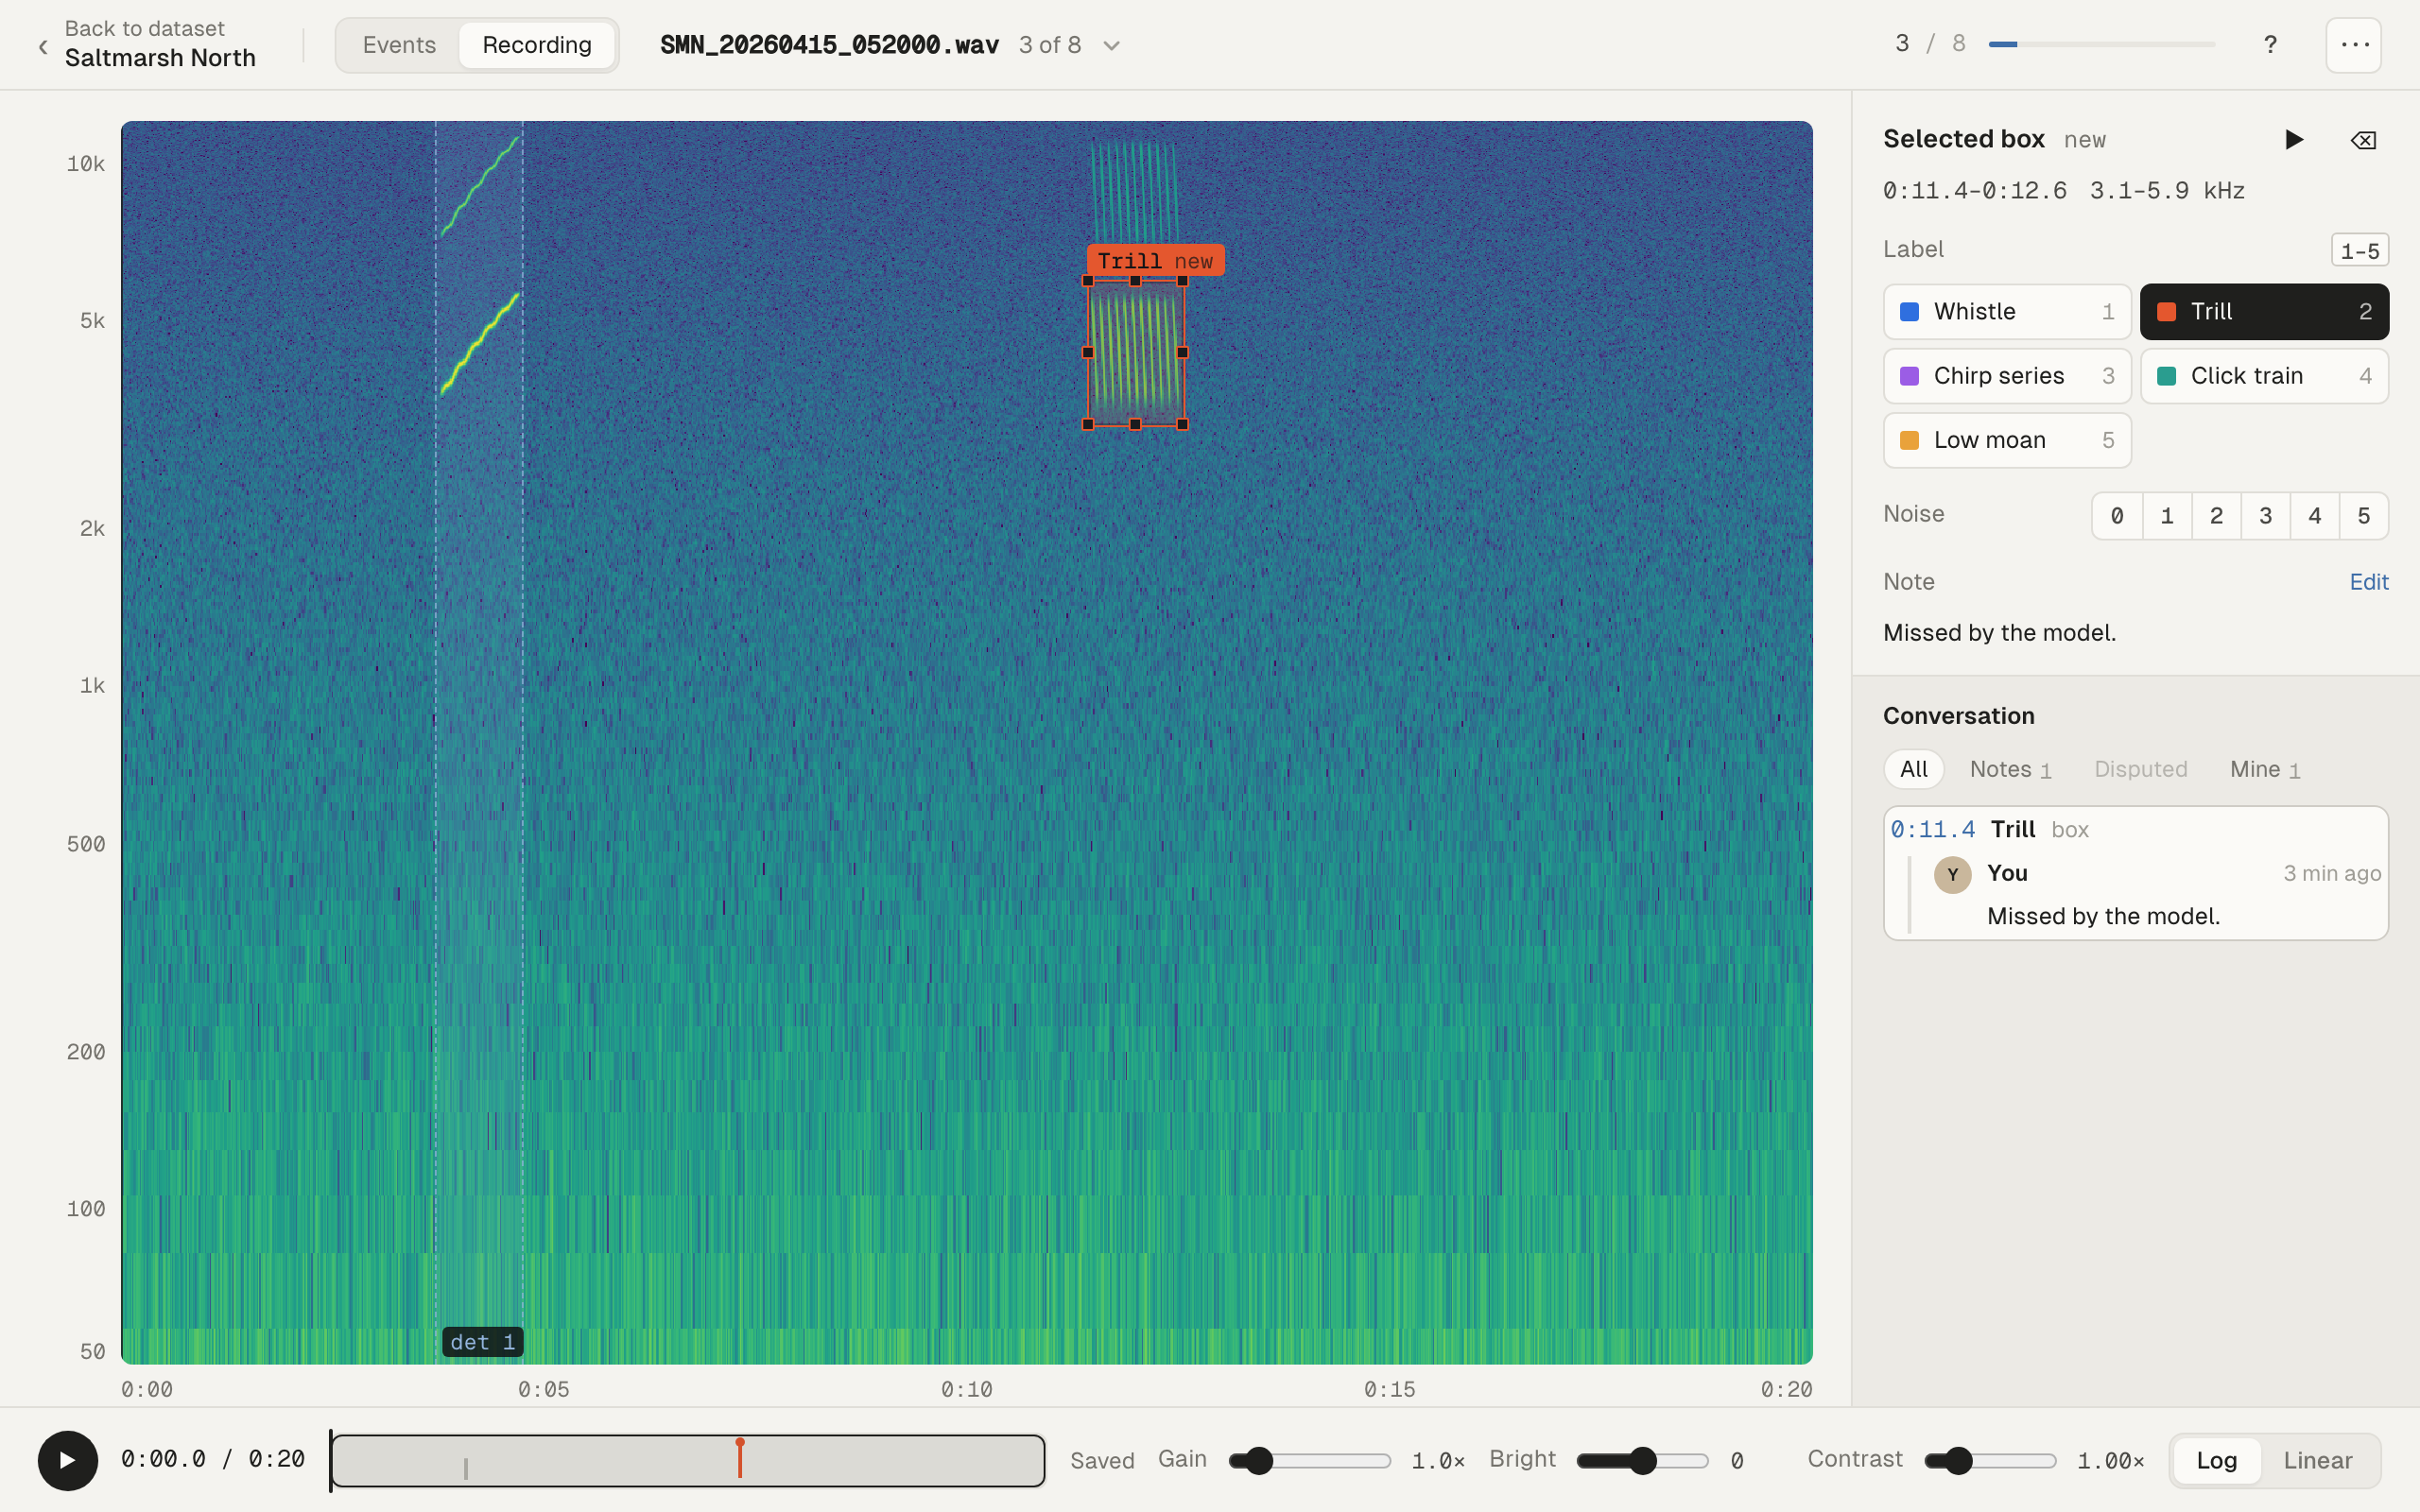
The spectrogram shows the part of the recording in view. The model’s detections are dashed columns, named “det 1”, “det 2” and so on. Boxes people drew carry a chip with their label. A box that tightens a detection also says which one, for example “det 3”. A box on its own says “new”.
The transport along the bottom has:
- Play and pause (Space) and the clock.
- The overview strip: the whole recording, with a mark for each box in its label’s colour, a faint mark for each detection, the stretch in view, and the playhead. Click or drag it to move the playhead. With the strip focused, ← and → move 5 seconds, and Home and End go to either end.
- Gain: above 1× boosts faint audio.
- Bright and Contrast: the spectrogram’s brightness and contrast. Double-click a slider to reset it, or use Reset. Sift remembers them for each recording on this computer.
- Log and Linear: the frequency axis (L).
- Whether your last change is saved.
Zoom and move
Section titled “Zoom and move”| Do this | To |
|---|---|
| Scroll, or = and - | Zoom time in and out |
| Shift and scroll | Zoom frequency |
| Scroll sideways | Move along the recording |
| R | Reset the zoom |
The Recording and view options menu (⋯) shows the time and frequency range in view. It also has Reset zoom, and Whole recording for long recordings.
Change recordings
Section titled “Change recordings”- ← and → (or S) go to the previous and next recording. The ‹ and › buttons do the same.
- The top bar shows where you are, for example “12 / 40”, and how many recordings have boxes.
- The recording picker: click the recording’s name in the top bar.
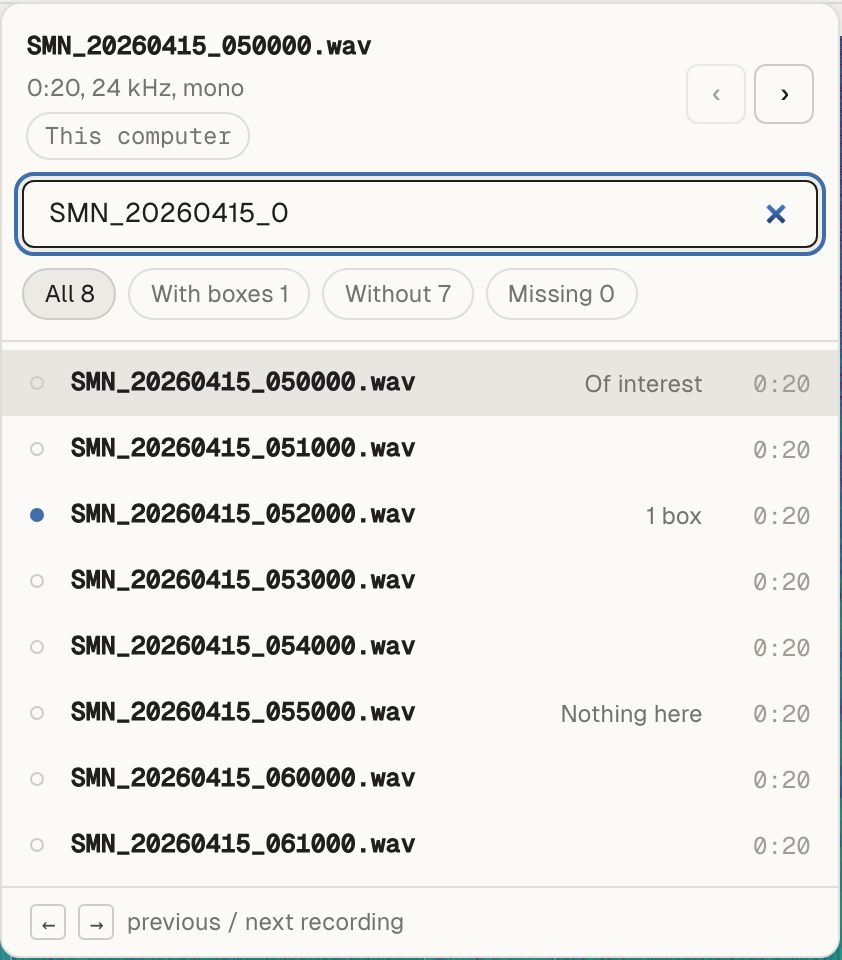
Type part of a file name to find it. Filter by All, With boxes, Without or Missing. Each row shows the recording’s boxes and length, or that it isn’t on this computer. Use ↑ and ↓ to move, Enter to open, and Esc to close.
Answer a detection in place
Section titled “Answer a detection in place”Click a detection’s column to select it. The panel then shows Detection N with the same choices as Events: the dataset’s labels (1 to 9), Nothing (0), Unsure (U), and Enter for its current label. You can rate its noise and add a note. Each is your own answer. The i button opens the detection’s details, as in Events.
Clicking a detection plays it. Dragging over a detection draws a box that tightens it. See Drawing boxes and adjusting bounds.
To hide the detections, turn off Detections in the options menu.
The right panel
Section titled “The right panel”The panel has two parts that stay in place as your selection changes. Drag the grip between them to resize them. Sift remembers the size on this computer. Double-click the grip to reset it.
flowchart TB
  subgraph Top["The selection"]
    B["A box: its range, play, delete,<br/>label, noise and note"]
    D["A detection: your answer,<br/>noise and note"]
    Nn["Nothing selected: the label<br/>new boxes get"]
  end
  subgraph Bottom["The conversation"]
    M["Recording marks and their notes"]
    BN["Notes on boxes"]
    AN["Answers with a note,<br/>or on disputed events"]
    R["Rulings"]
    Q["Request replies"]
  end
  Bottom -->|"click an entry"| J["Go to its box or detection"]
The conversation lists everything people said about this recording, in recording order. Filter it by All, Notes, Disputed or Mine. Each entry is tied to a box or detection. Click it to go there. Plain answers on events nobody disagrees about are left out, so a recording with a thousand detections gives you tens of entries, not thousands.
There is no separate list of every box. The spectrogram and the overview strip are that list.
In an organisation project, the speech-bubble button in the top bar asks a colleague about this recording. The one in the selection’s header asks about the selected box or detection. See Ask a colleague. Personal projects don’t have these buttons.
Troubleshooting
Section titled “Troubleshooting”- “This recording isn’t on this computer”: choose Skip to next available, or Fix missing audio. See Missing audio and finding it again.
- “Nothing to draw on yet”: the dataset has no recordings. Add audio to it first.
- A long recording takes a while to open: Sift prepares an overview of the whole recording first. The message says “Preparing the overview of the whole recording”.
- A click plays instead of drawing: the options menu has A click on the spectrogram, with Draws a box and Plays from there. Choose Draws a box. If you can only view the dataset, clicks always play.